Drawing a leaf with the parabola equation
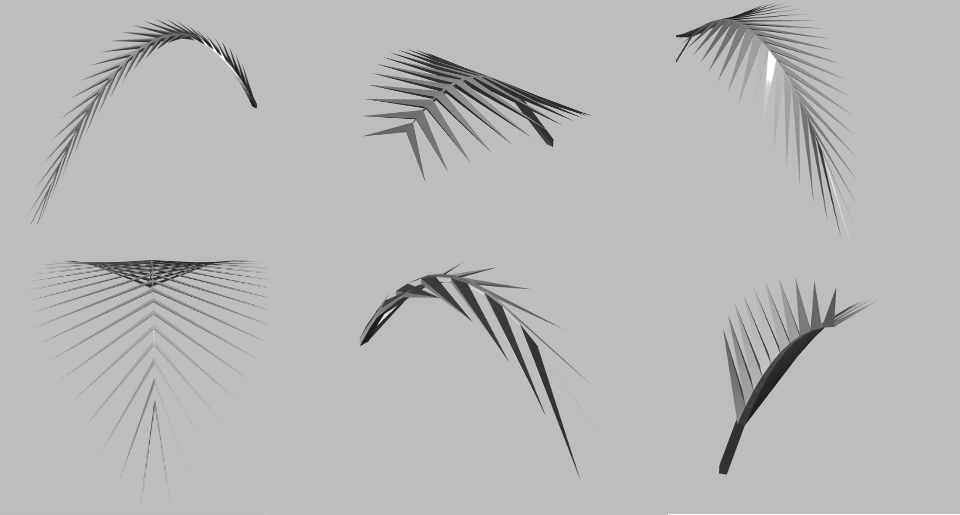
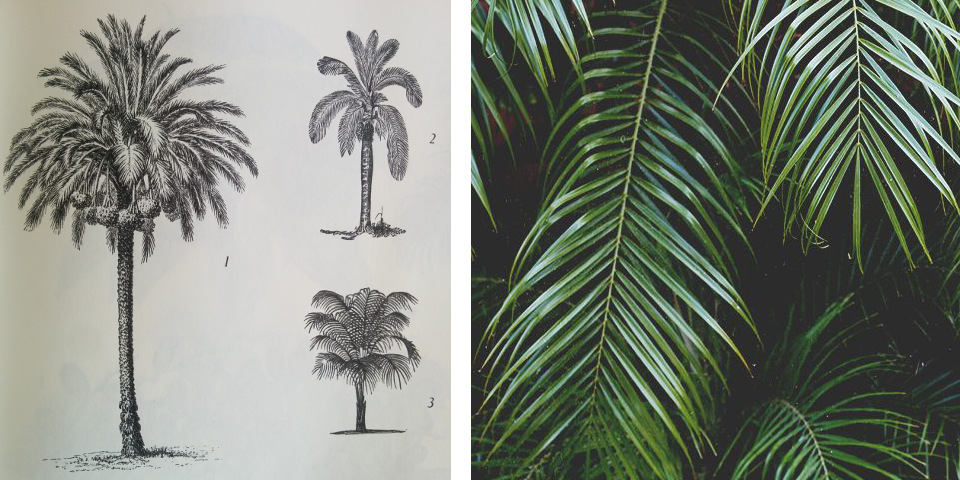
I was looking for a way to draw a palm’s leaf, and after watching this video by Inigo Quilez I’ve came up with a solution that gives me a reasonable result with high flexibility and a low number of vertices. It uses parabolas to describe the leaf inclination and the borders of the leaf. You can see a live demo here
Parabola
\[\]Thinking about the profile of the leaf from the top, in a simplified way, the border of the leaf can be described by two parabola’s curve mirrored, like the first picture on the left
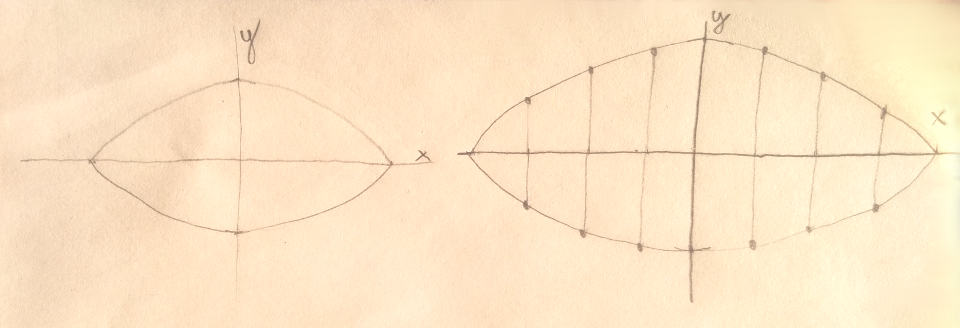
The equation that describes a parabola is \( y=ax^2 \) with \( a \neq 0\). Try to change the value of \(a\) in the slider to see how it affects the curve.
\[\]Now, if I want to start the border of the leaf a the point (0,0) and end it in the point with coordinates (30,0), the parabola needs to be shifted on the right. The highest point of the parabola is defined by the coordinates \( x_0, y_0 \). \( x_0 \) will have value 15, because 30/2 = 15, and the value of \( y_0 \) that will determinate the width of our leaf, can be selected in the slider on the right. The formula for a parabola translated horizontally is \( y=a(x - x_0)^2 + y_0 \)
With this formula, it is easy to define the border of our leaf because all we have to do, once we know, \(x_0\), \(x\), and \(a\) is first to calculate \(y_0\), with a method like the following one:
_getPointZero(a, x, x_0){
    return a * ((x - x_0)*(x - x_0));
}
And then, once we know \(y_0\), we find all the points on the curve with a function that implements the parabola equation:
_getVauleOnParabola(a, x, x_0, y_0){
    let y = a * ((x - x_0)*(x - x_0)) + y_0;
    return y;
}
Dividing
Once that we have the border on the top and the border on the bottom defined by the parabola equation, we have to subdivide the area of the leaf vertically. In the drawing below on the left, I’ve subdivided it in 8 parts and I’ve drawn just the first seven. In the second drawn on the right I’ve added a margin between each part, and I’ve added a stripe that separates the top part of the leaf from the bottom part, this stripe will be the stem of the leaf.
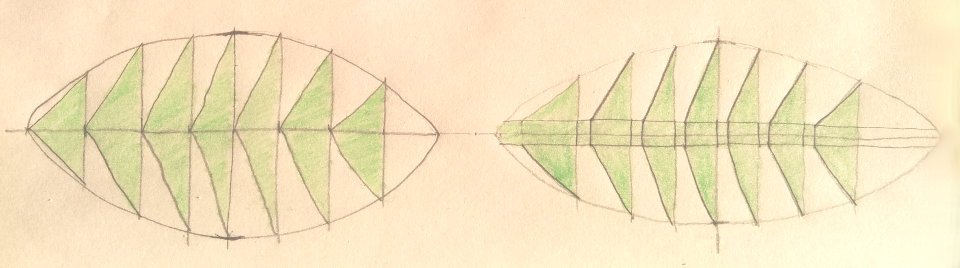
In the picture below, the leaf has been subdivided 12 times, and you can clearly see the profile ot the parabolas in the bottom and upper part of the leaf.

A third curve, a third dimension
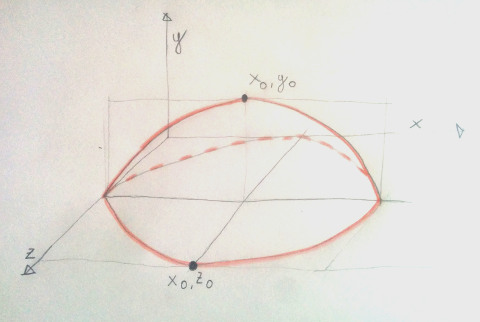
Now we will move the previous shape from a 2d to a 3d space. Creating faces, indexes and vertices of a 3D mesh is not the goal of this tutorial, you can find a lot of resources online, or you can have a look at the source code of my implementation using three.js. Let’s see how to find the points that define the leaf in a 3D space. Again, we will use parabolas. If two parabolas can define how large the leaf should be, another parabola can define the height of the leaf. We can plot the last equation on the x and z axis, and use the y and x axis to plot the parabola that defines the height. As we did before, we calculate first the position of the point \(x_0,z_0\) that allow us to calculate the coordinates of the points in two dimensions. Then we calculate the position of the point \(x_0,y_0\) that allow us to know the height on the y axis of each point.
Examples
Here some examples obtained with the method just described. I’ve added some other parameters, like the width and the length of the stem, and an offset value that moves the points a little bit more forward on the x axis, but the main part of the program that creates this meshes is that one just explained.